Historical data indicates potential turbulence for the U.S. stock market in the latter half of September, particularly in the week succeeding the September 15 monthly options expiration. This insight emerges from an extensive study by Nomura Securities, spanning over three decades.
This phenomenon, dubbed the “September Effect,” denotes a recurring trend where U.S. stock returns tend to soften during September. This effect becomes pronounced in the week following the options expiration. The Nomura study points out that in 26 out of the past 33 years, the S&P 500 Index has witnessed a decline during this particular week, with an average dip of about 1%.
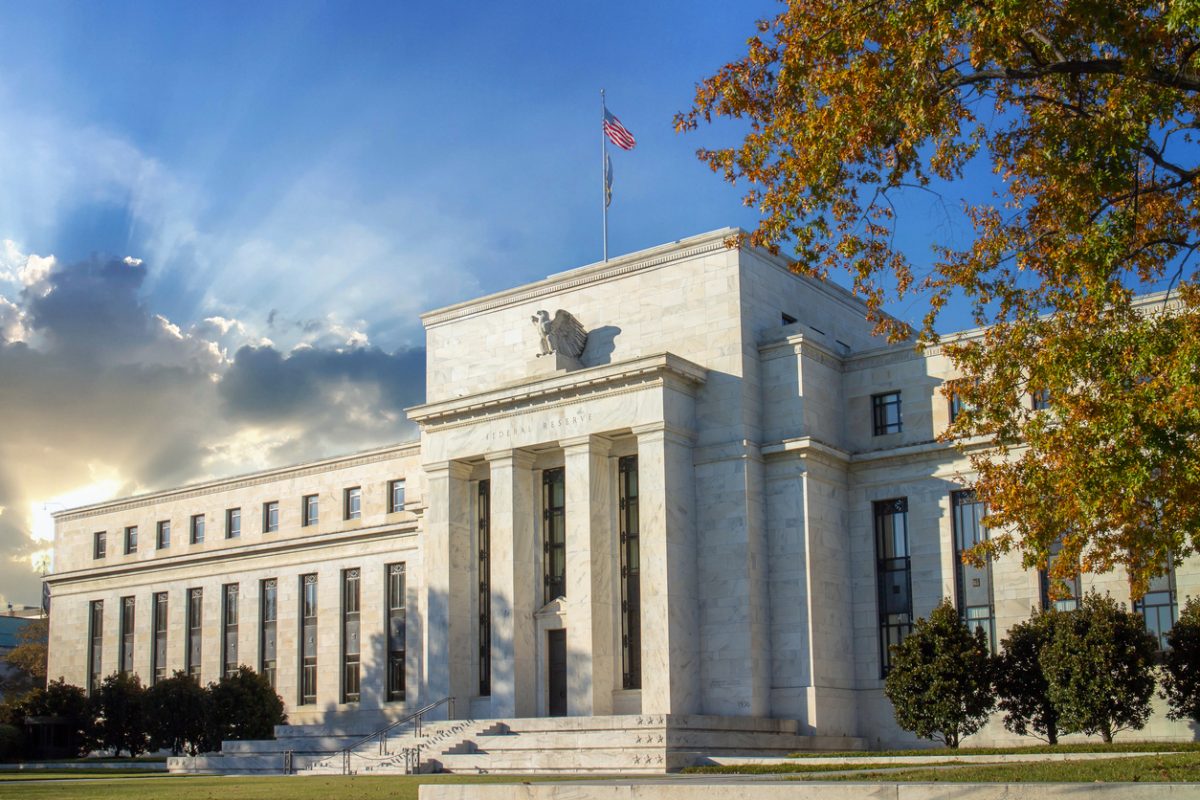
This upcoming week is notable as it coincides with the Federal Reserve’s monetary policy meeting, scheduled to wrap up on September 20. Market stakeholders anticipate the central bank to maintain the status quo on rates, but remain vigilant for hints on any prospective rate hikes later in the year.
Charlie McElligott, a strategist at Nomura, suggests that this observed dip might correlate with specific selling behaviors as mutual funds approach their fiscal year-end and households engage in tax-related sales.
A customary practice, known as “window dressing,” sees mutual funds offloading stocks in September to enhance the appeal of their portfolios as the October 31 tax year-end nears, exerting downward pressure on stock prices. Additionally, the impetus to settle estimated taxes prompts individual investors to offload stocks in September, further contributing to the decline.
Currently, the S&P 500 has seen a 0.9% decrease month-to-date. However, the market remains dynamic, with key influences like the forthcoming U.S. consumer prices report on Wednesday.
But there’s a glimmer of optimism: data from Tallbacken Capital Advisors indicates that during years when stocks have shown a strong upward trend from January to August, September usually fares well. Although the average return for all recorded Septembers since 1928 stands at -1.1%, in the 34 years where the S&P 500 surged by over 10% through August, there was an average gain of 0.3% in September.
Featured Image – iStock


