ATHENS, Greece, June 14, 2022 (GLOBE NEWSWIRE) — IMPERIAL PETROLEUM INC. (NASDAQ: IMPP), the “Company”), a ship-owning company providing petroleum product and crude oil seaborne transportation services, announced today its unaudited financial and operating results for the first quarter ended March 31, 2022.
OPERATIONAL AND FINANCIAL HIGHLIGHTS
- As of June 10, 2022, we had raised $135 million in total net proceeds, after underwriting discounts, from our public offerings. In addition, on June 13, 2022, we entered into agreements for warrant exercises expected to result in additional net proceeds to us of $21 million.
- On March 28, 2022, we took delivery of the product tanker Clean Nirvana.
- Subsequent to March 31, 2022 we took delivery of three additional tanker vessels: the product tanker Clean Justice was delivered on May 31, 2022, while our recently acquired suezmax vessels, the Suez Protopia and the Suez Enchanted, were each delivered on June 3, 2022.
- Within the course of five months we doubled the number of our vessels to 8 and tripled fleet capacity to 682,000 dwt.
- Fleet operational utilization of 98.9% in Q1 22’ – only 4 days commercial and 0 days technical off-hire.
- Revenues of $5.1 million in Q1 22’, same level as in Q1 21’ but approximately 28% higher than our revenues in Q4 21’ as a result of improved market rates.
- Net income of $0.2 million and EBITDA
1
of $2.6 million in Q1 22’ compared to net loss of $0.4 million in Q1 21’ and net loss of $1.5 million in Q4 21’. - Cash to date of about $55 million expected to increase to $76 million with the conclusion of the warrant transaction recently announced.
First Quarter 2022 Results:
Revenues
for the three months ended March 31, 2022 and 2021 amounted to $5.1 million.
Voyage expenses and vessels’ operating expenses
for the three months ended March 31, 2022 were $0.5 million and $1.8 million, respectively, compared to $1.4 million and $1.7 million, respectively, for the three months ended March 31, 2021. The $0.9 million decrease in voyage expenses is mainly due to the decrease of spot days by 120 days (81.6%) partially offset by the year on year increase in bunker costs. Vessels’ operating expenses remained stable.
General and administrative expenses
for the three months ended March 31, 2022 and 2021 were $0.1 million.
Depreciation
for the three months ended March 31, 2022 and 2021 was $2.2 million.
Interest and finance costs
for the three months ended March 31, 2022 and 2021 were $0.2 million and $0.002 million, respectively. The increase is attributable to the interest expense incurred relating to our loan agreement entered into in November 2021.- As a result of the above, for the three months ended March 31, 2022, the Company reported
net income
of $0.2 million, compared to net loss of $0.4 million for the three months ended March 31, 2021. Dividends paid on Series A Preferred Shares amounted to $0.4 million for the three months ended March 31, 2022. - The
weighted average number of shares of common stock outstanding, basic
, for the three months ended March 31, 2022 was 17.7 million.
Loss per share, basic and diluted,
for the three months ended March 31, 2022 amounted to $0.01.
EBITDA
for the three months ended March 31, 2022 amounted to $2.6 million. Reconciliations of EBITDA to Net (Loss)/Income are set forth below.- An average of 4.0 vessels were owned by the Company during the three months ended March 31, 2022 and 2021.
- As of March 31, 2022,
cash and cash equivalents
amounted to $82.2 million and total debt amounted to $27.8 million. During the three months ended March 31, 2022 no debt repayments occurred.
CEO
Harry Vafias Commented
Having raised a total of $135 million from our equity offerings we considered a number of acquisition candidates to acquire and grow our fleet; we managed within a brief period of time to identify, acquire and take delivery of four tankers, doubling our fleet size and almost tripling our fleet’s cargo carrying capacity.
The outbreak of war in Ukraine shocked shipping markets and altered oil trading patterns resulting in an improvement in the charter market. For Imperial Petroleum the first quarter of 2022 was transitional; the vessels we acquired were added to our fleet towards and after the end of this first quarter while improved charter rates for our existing vessels materialized from the beginning of the second quarter. Nevertheless, this was a profitable quarter with a significant improvement in revenue and earnings from the last quarter of 2021; the strong tanker market, the dynamic fleet expansion, along with improved charter rates bodes well for the second quarter to be even more profitable.
Our remaining cash balance is about $55 million following the $78 million spent on vessel acquisitions and before we incur debt for these acquisitions which will increase our cash balance even further, as will the warrant exercise transaction we recently announced that is expected to result in additional net proceeds of $21 million. We are committed to growing our Company further and will seek to expand our fleet so that Imperial Petroleum becomes a true pioneer in the field of energy shipping.
Conference Call details:
On June 14, 2022 at 11:00 am ET, the company’s management will host a conference call to discuss the results and the company’s operations and outlook.
Conference Call details:
Participants should dial into the call 10 minutes before the scheduled time using the following numbers: +1 8778709135 (US Toll Free Dial In) or 08002796619 (UK Toll Free Dial In).
Access Code: 1732718
In case of any problems with the above numbers, please dial +1 6467413167 (US Toll Dial In), +44 (0) 2071 928338 (Standard International Dial In).
Access Code: 1732718
Slides and audio webcast:
There will also be a live and then archived webcast of the conference call, through the IMPERIAL PETROLEUM INC. website (www.ImperialPetro.com). Participants to the live webcast should register on the website approximately 10 minutes prior to the start of the webcast.
About IMPERIAL PETROLEUM INC.
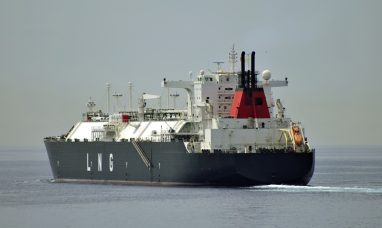
Imperial Petroleum Inc. is a ship-owning company providing petroleum product and crude oil seaborne transportation services. The Company owns a total of eight tanker vessels; five M.R. product tankers, one Aframax oil tanker and two Suezmax tankers with a total capacity of approximately 682,000 deadweight tons (dwt). Imperial Petroleum Inc.’s shares of common stock and 8.75% Series A Cumulative Redeemable Perpetual Preferred Stock are listed on the Nasdaq Capital Market and trade under the symbols “IMPP” and “IMPPP”, respectively.
Forward-Looking Statements
Matters discussed in this release may constitute forward-looking statements. Forward-looking statements reflect our current views with respect to future events and financial performance and may include statements concerning plans, objectives, goals, strategies, future events or performance, or impact or duration of the COVID-19 pandemic and underlying assumptions and other statements, which are other than statements of historical facts. The forward-looking statements in this release are based upon various assumptions, many of which are based, in turn, upon further assumptions, including without limitation, management’s examination of historical operating trends, data contained in our records and other data available from third parties. Although IMPERIAL PETROLEUM INC. believes that these assumptions were reasonable when made, because these assumptions are inherently subject to significant uncertainties and contingencies which are difficult or impossible to predict and are beyond our control, IMPERIAL PETROLEUM INC. cannot assure you that it will achieve or accomplish these expectations, beliefs or projections. Important factors that, in our view, could cause actual results to differ materially from those discussed in the forward-looking statements include the impact of the COVID-19 pandemic and efforts throughout the world to contain its spread, the strength of world economies and currencies, general market conditions, including changes in charter hire rates and vessel values, charter counterparty performance, changes in demand that may affect attitudes of time charterers to scheduled and unscheduled drydockings, shipyard performance, changes in IMPERIAL PETROLEUM INC’s operating expenses, including bunker prices, drydocking and insurance costs, ability to obtain financing and comply with covenants in our financing arrangements, or actions taken by regulatory authorities, potential liability from pending or future litigation, domestic and international political conditions, the conflict in Ukraine and related sanctions, potential disruption of shipping routes due to accidents and political events or acts by terrorists.
Risks and uncertainties are further described in reports filed by IMPERIAL PETROLEUM INC. with the U.S. Securities and Exchange Commission.
Fleet List and Fleet Deployment
For information on our fleet and further information:
Visit our website at
www.ImperialPetro.com
Fleet Data:
The following key indicators highlight the Company’s operating performance during the periods ended March 31, 2021 and March 31, 2022.
FLEET DATA |
Q1 2021 |
Q1 2022 |
| Average number of vessels (1) | 4.00 | 4.04 |
| Period end number of owned vessels in fleet | 4 | 5 |
| Total calendar days for fleet (2) | 360 | 364 |
| Total voyage days for fleet (3) | 359 | 364 |
| Fleet utilization (4) | 99.7% | 100.0% |
| Total charter days for fleet (5) | 212 | 337 |
| Total spot market days for fleet (6) | 147 | 27 |
| Fleet operational utilization (7) | 87.8% | 98.9% |
1)
Average number of vessels
is the number of owned vessels that constituted our fleet for the relevant period, as measured by the sum of the number of days each vessel was a part of our fleet during the period divided by the number of calendar days in that period.
2)
Total calendar days
for fleet are the total days the vessels we operated were in our possession for the relevant period including off-hire days associated with major repairs, drydockings or special or intermediate surveys.
3)
Total voyage days
for fleet reflect the total days the vessels we operated were in our possession for the relevant period net of off-hire days associated with major repairs, drydockings or special or intermediate surveys.
4)
Fleet utilization
is the percentage of time that our vessels were available for revenue generating voyage days, and is determined by dividing voyage days by fleet calendar days for the relevant period.
5)
Total charter days
for fleet are the number of voyage days the vessels operated on time or bareboat charters for the relevant period.
6)
Total spot market charter days
for fleet are the number of voyage days the vessels operated on spot market charters for the relevant period.
7)
Fleet operational utilization
is the percentage of time that our vessels generated revenue, and is determined by dividing voyage days excluding commercially idle days by fleet calendar days for the relevant period.
Reconciliation of EBITDA:
EBITDA represents net (loss)/income before interest and finance costs, interest income and depreciation.
EBITDA is not a recognized measurement under U.S. GAAP. Our calculation of EBITDA may not be comparable to that reported by other companies in the shipping industry or other industries.
EBITDA measurement is included herein because it is a basis, upon which our investors and we assess our financial performance. It allows us to present our performance from period to period on a comparable basis and provides investors with a means of better evaluating and understanding our operating performance.
(Expressed in United States Dollars,
|
Three Months Period Ended March 31st, |
|
2021 |
2022 |
|
Net (loss)/income – EBITDA |
||
Net (loss)/income |
(426,275) |
218,382 |
| Plus interest and finance costs | 1,926 | 209,014 |
| Less interest income | (4) | — |
| Plus depreciation | 2,168,666 | 2,168,666 |
EBITDA |
1,744,313 |
2,596,062 |
Imperial Petroleum Inc.
Unaudited Consolidated Statements of Operations
(Expressed in United States Dollars, except for number of shares)
For The Three Months Ended March 31, |
||||||||
2021 |
2022 |
|||||||
Revenues |
||||||||
| Revenues | 5,069,525 | 5,116,378 | ||||||
Expenses |
||||||||
| Voyage expenses | 1,290,532 | 457,428 | ||||||
| Voyage expenses – related party | 64,872 | 61,871 | ||||||
| Vessels’ operating expenses | 1,728,520 | 1,744,016 | ||||||
| Vessels’ operating expenses – related party | 15,000 | 15,000 | ||||||
| Management fees | 130,050 | 131,810 | ||||||
| General and administrative expenses | 90,532 | 115,316 | ||||||
| Depreciation | 2,168,666 | 2,168,666 | ||||||
Total expenses |
5,488,172 |
4,694,107 |
||||||
(Loss)/Income from operations |
(418,647) |
422,271 |
||||||
Other (expenses)/income |
||||||||
| Interest and finance costs | (1,926) | (209,014) | ||||||
| Interest income | 4 | — | ||||||
| Foreign exchange (loss)/gain | (5,706) | 5,125 | ||||||
Other expenses, net |
(7,628) |
(203,889) |
||||||
(Loss)/Net Income |
(426,275) |
218,382 |
||||||
Loss per share, Basic |
(0.09) | (0.01) | ||||||
Weighted average number of shares, Basic |
4,775,272 | 17,700,385 | ||||||
Imperial Petroleum Inc.
Unaudited Consolidated Balance Sheets
(Expressed in United States Dollars)
December 31, |
March 31, |
||||||
2021 |
2022 |
||||||
Assets |
|||||||
Current assets |
|||||||
| Cash and cash equivalents | 3,389,834 | 82,202,037 | |||||
| Restricted cash | 451,225 | 1,804,898 | |||||
| Receivables from related party | 355,023 | 644,448 | |||||
| Trade and other receivables | 1,400,275 | 1,765,270 | |||||
| Inventories | 258,846 | 1,328,812 | |||||
| Advances and prepayments | 150,544 | 184,051 | |||||
Total current assets |
6,005,747 |
87,929,516 |
|||||
Non current assets |
|||||||
| Vessels, net | 119,962,984 | 130,419,318 | |||||
| Other receivables | — | 6,442 | |||||
| Restricted cash | 2,500,000 | 2,500,000 | |||||
Total non current assets |
122,462,984 |
132,925,760 |
|||||
Total assets |
128,468,731 |
220,855,276 |
|||||
Liabilities and Stockholders’ Equity |
|||||||
Current liabilities |
|||||||
| Trade accounts payable | 1,430,251 | 2,794,331 | |||||
| Payable to related parties | 1,119,055 | 1,160,971 | |||||
| Accrued liabilities | 486,674 | 1,391,940 | |||||
| Customer deposits | 368,000 | 368,000 | |||||
| Deferred income | 482,321 | 535,782 | |||||
| Current portion of long-term debt | 4,747,616 | 4,746,393 | |||||
Total current liabilities |
8,633,917 |
10,997,417 |
|||||
Non current liabilities |
|||||||
| Long-term debt | 23,088,971 | 23,090,194 | |||||
Total non current liabilities |
23,088,971 |
23,090,194 |
|||||
Total liabilities |
31,722,888 |
34,087,611 |
|||||
Commitments and contingencies |
|||||||
Stockholders’ equity |
|||||||
| Capital stock | 47,753 | 700,802 | |||||
| Preferred stock | 7,959 | 7,959 | |||||
| Additional paid-in capital | 97,161,688 | 186,312,079 | |||||
| Accumulated deficit | (471,557) | (253,175) | |||||
Total stockholders’ equity |
96,745,843 |
186,767,665 |
|||||
Total liabilities and stockholders’ equity |
128,468,731 |
220,855,276 |
|||||
Imperial Petroleum Inc.
Unaudited Consolidated Statements of Cash Flows
(Expressed in United States Dollars)
For The Three Months Ended March 31, |
|||||||||
2021 |
2022 |
||||||||
Cash flows from operating activities |
|||||||||
| Net (loss)/income for the period | (426,275) | 218,382 | |||||||
Adjustments to reconcile net income to net cash |
|||||||||
provided by operating activities: |
|||||||||
| Depreciation | 2,168,666 | 2,168,666 | |||||||
Changes in operating assets and liabilities: |
|||||||||
(Increase)/decrease in |
|||||||||
| Trade and other receivables | (1,495,773) | (371,437) | |||||||
| Other current assets | 104,415 | — | |||||||
| Inventories | 109,711 | (1,069,966) | |||||||
| Advances and prepayments | (35,738) | (33,507) | |||||||
Increase/(decrease) in |
|||||||||
| Trade accounts payable | — | 1,364,080 | |||||||
| Balances with related parties | 547,062 | (247,509) | |||||||
| Accrued liabilities | 52,339 | 905,266 | |||||||
| Deferred income | 444,375 | 53,461 | |||||||
Net cash provided by operating activities |
1,468,782 |
2,987,436 |
|||||||
Cash flows from investing activities |
|||||||||
| Acquisition and improvement of vessels | (142,600) | (12,625,000) | |||||||
Net cash used in investing activities |
(142,600) |
(12,625,000) |
|||||||
Cash flows from financing activities |
|||||||||
| Net transfers to former Parent Company | (1,964,785) | — | |||||||
| Proceeds from follow-on offerings | — | 96,772,890 | |||||||
| Stock issuance costs | — | (6,534,204) | |||||||
| Dividends paid on preferred shares | — | (435,246) | |||||||
Net cash (used in)/provided by financing activities |
(1,964,785) |
89,803,440 |
|||||||
| Net (decrease)/ increase in cash, cash equivalents and restricted cash | (638,603) | 80,165,876 | |||||||
| Cash, cash equivalents and restricted cash at beginning of year | 7,616,555 | 6,341,059 | |||||||
Cash, cash equivalents and restricted cash at end of period |
6,977,952 |
86,506,935 |
|||||||
Cash breakdown |
|||||||||
| Cash and cash equivalents | 5,812,921 | 82,202,037 | |||||||
| Restricted cash, current | 1,165,031 | 1,804,898 | |||||||
| Restricted cash, non current | — | 2,500,000 | |||||||
Total cash, cash equivalents and restricted cash shown in the statements of cash flows |
6,977,952 |
86,506,935 |
|||||||
1
EBITDA is a non-GAAP measure. Refer to the reconciliation of this measure to the most directly comparable financial measure in accordance with GAAP set forth later in this release.
Company Contact:
Fenia Sakellaris
IMPERIAL PETROLEUM INC.
00-30-210-6250-001
E-mail: [email protected]